 React Analytics Charts
⛔️ DEPRECATED
React Analytics Charts
⛔️ DEPRECATION NOTICE: Google Analytics 4 is replacing Universal Analytics, making this library obsolete. After July 1, 2023 all standard Universal Analytics properties will stop processing new hits. Read more here.
React components to easily embed Google Analytics charts on your React site. Uses the Google Analytics Embed API.
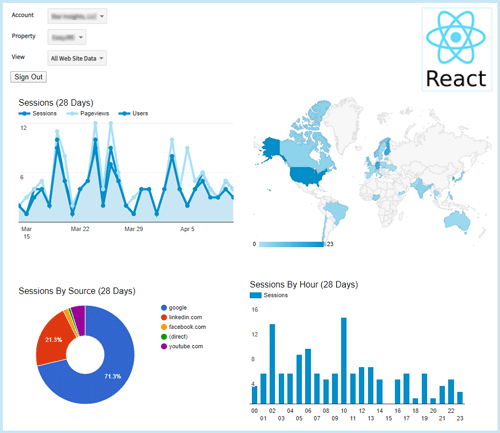
👁️ Full Example
For API hooks, check out: React Use Analytics API
Overview
Easily embed Google Analytics charts on your React site using this component library, which leverages the Google Analytics Embed API.
Choose from 10+ commonly used drop-in chart components, or build your own custom charts and render them as bar charts, column charts, geo charts, line charts, pie charts, and tables.
See the AnalyticsDashboard documentation for a full example, or reference any of the available charts for individual examples.
Features include:
- 🙌 Simple and quick
- Drop Google Analytics charts onto your React site within minutes.
- 🎁 Pre-made drop-in charts
- Choose from 10+ pre-made commonly used charts that you can use right away.
- ⚒️ Easy to build custom charts
- Building your own charts is easy, too!
- 💼 Handles overhead for you
- ✨ Full examples and rich documentation
- Quickly refer to docs on queries and charts, all from one place, with plenty of examples.
Installation
npm i react-analytics-charts
Quick Start
First, you will need an OAuth Client ID from Google to access the Analytics API. See How To Get An OAuth Client ID From Google to make this as easy and painless as possible.
You can also use an access token. See the auth Options docs for more information.
Analytics Dashboard
The AnalyticsDashboard component handles loading the Google Analytics Embed API, sign-in and sign-out, and view selection for you. See the full example.
The following example embeds an analytics dashboard with two charts.
Be sure to change the authOptions to use your clientId or serverAuth.access_token.
From there, you can experiment with other drop-in charts or try creating your own.
import { AnalyticsDashboard } from 'react-analytics-charts';// Over ten different commonly used charts are availableimport { SessionsByDateChart, SessionsGeoChart } from 'react-analytics-charts';
<AnalyticsDashboardauthOptions={{ clientId: '123456789012-abc123def456ghi789jkl012mno345p.apps.googleusercontent.com' }}renderCharts={(gapi, viewId) => {return (<div><SessionsByDateChart gapi={gapi} viewId={viewId} showPageViews showUsers /><SessionsGeoChart gapi={gapi} viewId={viewId} showPageViews />... More charts here ...</div>);}}/>
See the Charts Overview for more charts, and AnalyticsDashboard for more information on the dashboard itself.
Standalone Charts
All of the charts in this library can be used standalone.
If you have the Google Analytics Embed API (gapi) loaded and ready, and you know which view ID to query, you can pick any of the available charts and drop them right onto your site as standalone charts.
For example, if your view ID is ga:123456789:
import { SessionsByDateChart } from 'react-analytics-charts';
<SessionsByDateChart gapi={gapi} viewId="ga:123456789" />
You must be authorized. You can use the ViewSelector example to determine your view ID, and the useAnalyticsApi hook to easily load the gapi API and authorize. If you use the AnalyticsDashboard, this will all be handled for you.
TypeScript
Type definitions have been included for TypeScript support.
Contributing
Open source software is awesome and so are you. 😎
Feel free to submit a pull request for bugs or additions, and make sure to update tests as appropriate. If you find a mistake in the docs, send a PR! Even the smallest changes help.
For major changes, open an issue first to discuss what you'd like to change.
See Kindling for npm script documentation.
⭐ Found It Helpful? Star It!
If you found this project helpful, let the community know by giving it a star: 👉⭐